
A lot of things happen every second, 4.3 new babies are born, 9.4 websites are created, Nike earns $600, and much more. Every second counts and has got value in someone’s life!
Likewise, it’s important to get real-time analysis on every business, a valuable or a potential customer might be visiting your website at any second. That’s why it’s critical for every business to get real-time data with the least latency rate.
The business intelligence system helps businesses to analyze data in real-time so that no important aspects get missed! Let’s learn more about business intelligence tools and the importance of analyzing real-time data.
Is Business Intelligence the Right Tool for Data Analysis?
Till now, the best choice to analyze the business in real-time as well as to drive useful insights is a business intelligence tool. Here is a business intelligence dashboard that provides access to the business data as a one-click solution.
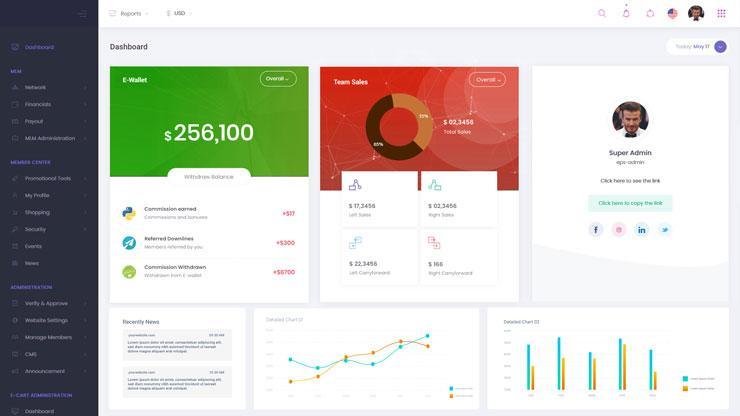
See, the above dashboard comprises multiple sets of data that are fragmented and presented under different data labels.
Users or companies just have to access this dashboard to analyze various business metrics or otherwise known as business key performance indicators (KPIs). Different KPI cards help in analyzing the company’s performance and plan strategies accordingly.
The following section provides 6 key business metrics that can be analyzed using business intelligence tools. You can answer the question and find if it’s worth investing software with a business intelligence dashboard or not.
Key Business Metrics to Analyze using Business Intelligence Tools
As mentioned earlier, business intelligence is the right choice for analytical tools. Here are the top 7 key business metrics that can be analyzed right from the dashboard.
- Sales and marketing analysis
- Cost per customer analysis
- Qualified lead analysis
- Business trend analysis
- Milestone tracker/Business goal analysis
- Customer retention & satisfaction analysis
There are many other key performance indicators for analyzing the business and all such metrics are configurable from the BI dashboard.
These factors are analyzed in real-time with the least latency value. All such data are collected and recorded from time-to-time and then analyzed to find useful insights.
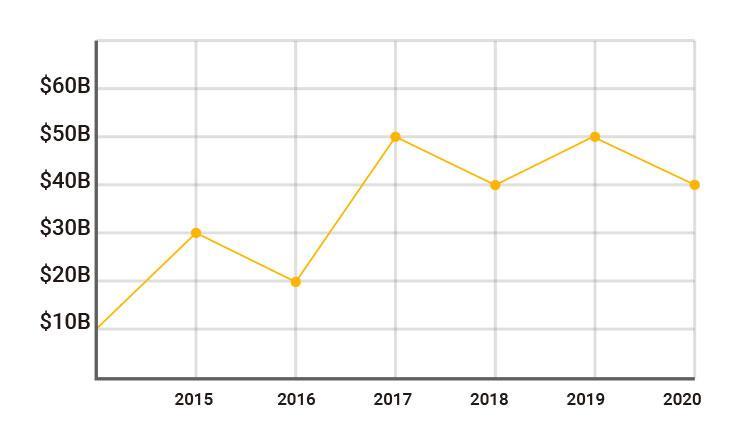
See the above image, it shows the growth easily. Companies can understand the growth at a glance from the representation, that’s because of the way it is represented. Data visualization helps people to learn quickly by representing data using graphs, mapping, etc.
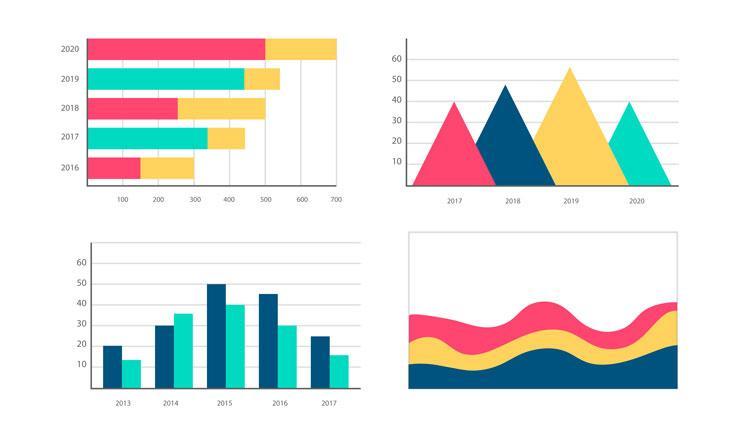
Here are some examples of data visualization models to understand how effective they are.
The above method is used to understand the growth rate which is one of the key business metrics. Likewise, other metrics can be analyzed in the following way;
1) Sales & marketing analysis:
- Sales metrics gives the values measurable from time-to-time which let companies monitor the achievements of the company.
- Marketing analysis lets companies analyze the success rate of strategies from different marketing channels.
2) Cost per customer analysis:
- Cost per customer analysis gives a clear picture of customer acquisition value in comparison with marketing cost.
- A high cost per customer value always favours business growth which suggests business consistency.
3) Qualified lead analysis:
- As the business grows, more leads will be generated but not all leads end up in potential customer conversion.
- Qualified leads help companies to analyze if they are targeting the right audience or not.
4) Business trend analysis:
- Data assessment from the recent time periods helps companies to find the trends involved in the business.
- Usually, these trends are easily identified from data visualization, and the data used for trend analysis is broadly known as historic data.
5) Milestone tracker/Business goal analysis:
- It’s important to analyze the performance of employees by checking their milestone achievements or goal completion data.
- As a team, it is very important to be on the mark every time and achieve the business goals with individual contributions.
6) Customer retention & satisfaction analysis:
- Analyze whether the customer find satisfaction with the company’s product or not, based on their retention value
- A satisfied customer buys the product multiple times and this demand must be maintained to sustain further for the future
In short, real-time data is compared with historic data to generate business insights. Company decisions are taken based on these insights. The intelligent system will recommend valuable feedback and the decision-makers need to evaluate them to build strategies.
Smart decisions based on data has a great value and mostly, it shows positive growth in business terms.
The accessibility to RTBI tools – Any device suite
Where can you get access to real-time business intelligence (RTBI) tools? You guessed that right. From advanced business applications or software.
Such an advanced system possesses the ability of business intelligence and is accessible from the dashboard. The neatly arranged dashboard helps companies to navigate through all the business data with at-a-glance data visualization.
These applications can be accessed via mobile or similar gadgets. As per data, about 60.42% of the world’s population uses mobile phones. Considering this large group of users, it’s an assured fact that they love to access these advanced tools from their mobile devices.
If you are an entrepreneur or newbie to the business, consider having a mobile version of your software. It comes in handy as mobile users are evolving day after day.
Final Thoughts
So, let me conclude this article with a note; “The solution to your business problems is there within your data. It’s just a matter to convert these raw data into a structured form and then analyze the data.
Analyzing the data gives useful insights which in turn provides solutions for all the low performing business metrics.”
Also Read: